13.1 Weight gain and junk food. -- This exercise is similar to Lab 3 in HS 267
(A) Post hoc -- LSD method
H0: �1 = �2; tstat = (13.14- 3.44) / 0.5586 = -4.12, df = 12; P = 0.0014; highly significant (reject H0)
H0: �1 = �3; tstat = (13.14-9.14) / 0.5586 = 3.58, df = 12; P = 0.0038; highly significant
H0: �2 = �3; tstat = (13.44 - 9.14) / 0.5586 = 7.69, df = 12; P @ .0000; highly significant
Conclusion: all three groups differ significantly. We can be confident in rejecting all three the null hypotheses.(B) Post hoc -- Bonferroni's method
H0: �1 = �2; P = 0.0014 � 3 = .0042; highly significant ( reject H0)
H0: �1 = �3; P = 0.0038 � 3 = .0114; significant
H0: �2 = �3; P @ .0000 � 3 = .0000; highly significant(C) SPSS computations should be identical to yours, except for rounding error.
(D) List the three types of systematic errors ( biases) that may effect statistical analyses. (1) Information bias (2) Selection bias (3) Confounding.
(E) In addition to the validity assumptions, ANOVA has distributional and sampling assumptions. Name these. (1) Sampling independence (2) Normality of sampling error (3) Equal variance
(F) Test the groups for unequal variance using Levene's procedure via SPSS. H0: s21 = s22 = s23 vs. H1: at least one population variance differs, FLevene = 2.45 with 2 and 12 df; P = 0.13 .The difference in variances is not significant.
(G) Conduct a Kruskal-Wallis test with SPSS. H0: population have equal averages vs. H1: at least one population average differs. c2K-W = 11.18, df = 2, P = 0.004 (via SPSS) The groups differ significantly.
13.3 The problem of multiple comparisons.
(A) What is the probability of making 3 correct independent decisions in a row? 0.993 = 0.9703 What is the probability of getting at least 1 of the three wrong? 1 - 0.9703 = 0.0297
(B) What is the probability of making 10 correct independent decisions in a row? 0.9910 = 0.9044 What is the probability of getting at least 1 wrong out of the 10? 1 - 0.9044 = 0.0956
(C) What is the probability of making 20 correct independent decisions in a row? 0.9920 = 0.8179 What is the probability of making at least one incorrect decisions out of the 20? 1 - 0.1821 = 0.1821
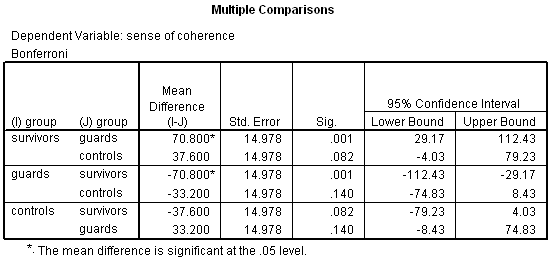
13.5 Sense of coherence. Conduct post-hoc comparisons using a Bonferroni adjustment. Summarize the results. The SPSS output below shows a significant difference between survivors and guards (P = 0.001), and a marginally significant difference between survivors and controls (P = 0.082).

13.7 Maternal adaptation (Howell, 1995, pp. 302 - 304; mat-role.sav). Place holder.
13.8 - 13.20 reserved for future use
13.21 Testosterone levels in roosters (visual inspection of boxplots). ... would you perform ANOVA on these data? Explain your reasoning. No. Variances differ by wide margins.
13.23 Smoking and birth weight, unequal variances? Rebut this criticism .... The sample standard deviations do not vary much, ranging from 1.17 to 0.72. No standard deviations is more than twice any another. (You can tell a lot about variability by looking at sample standard deviations.)
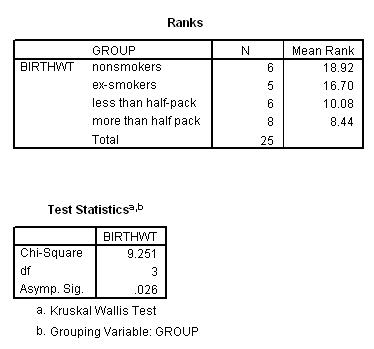
13.25 Smoking and birth weight (K-W). Conduct a K-W procedure, and compare its results to those achieved by one-way ANOVA. Output (below) reveals X2stat = 9.25 with 3 df, P = 0.026. This P value is nearly the same as the one produced by ANOVA.
