Enrollment Data
EES Enrollment by Academic Year
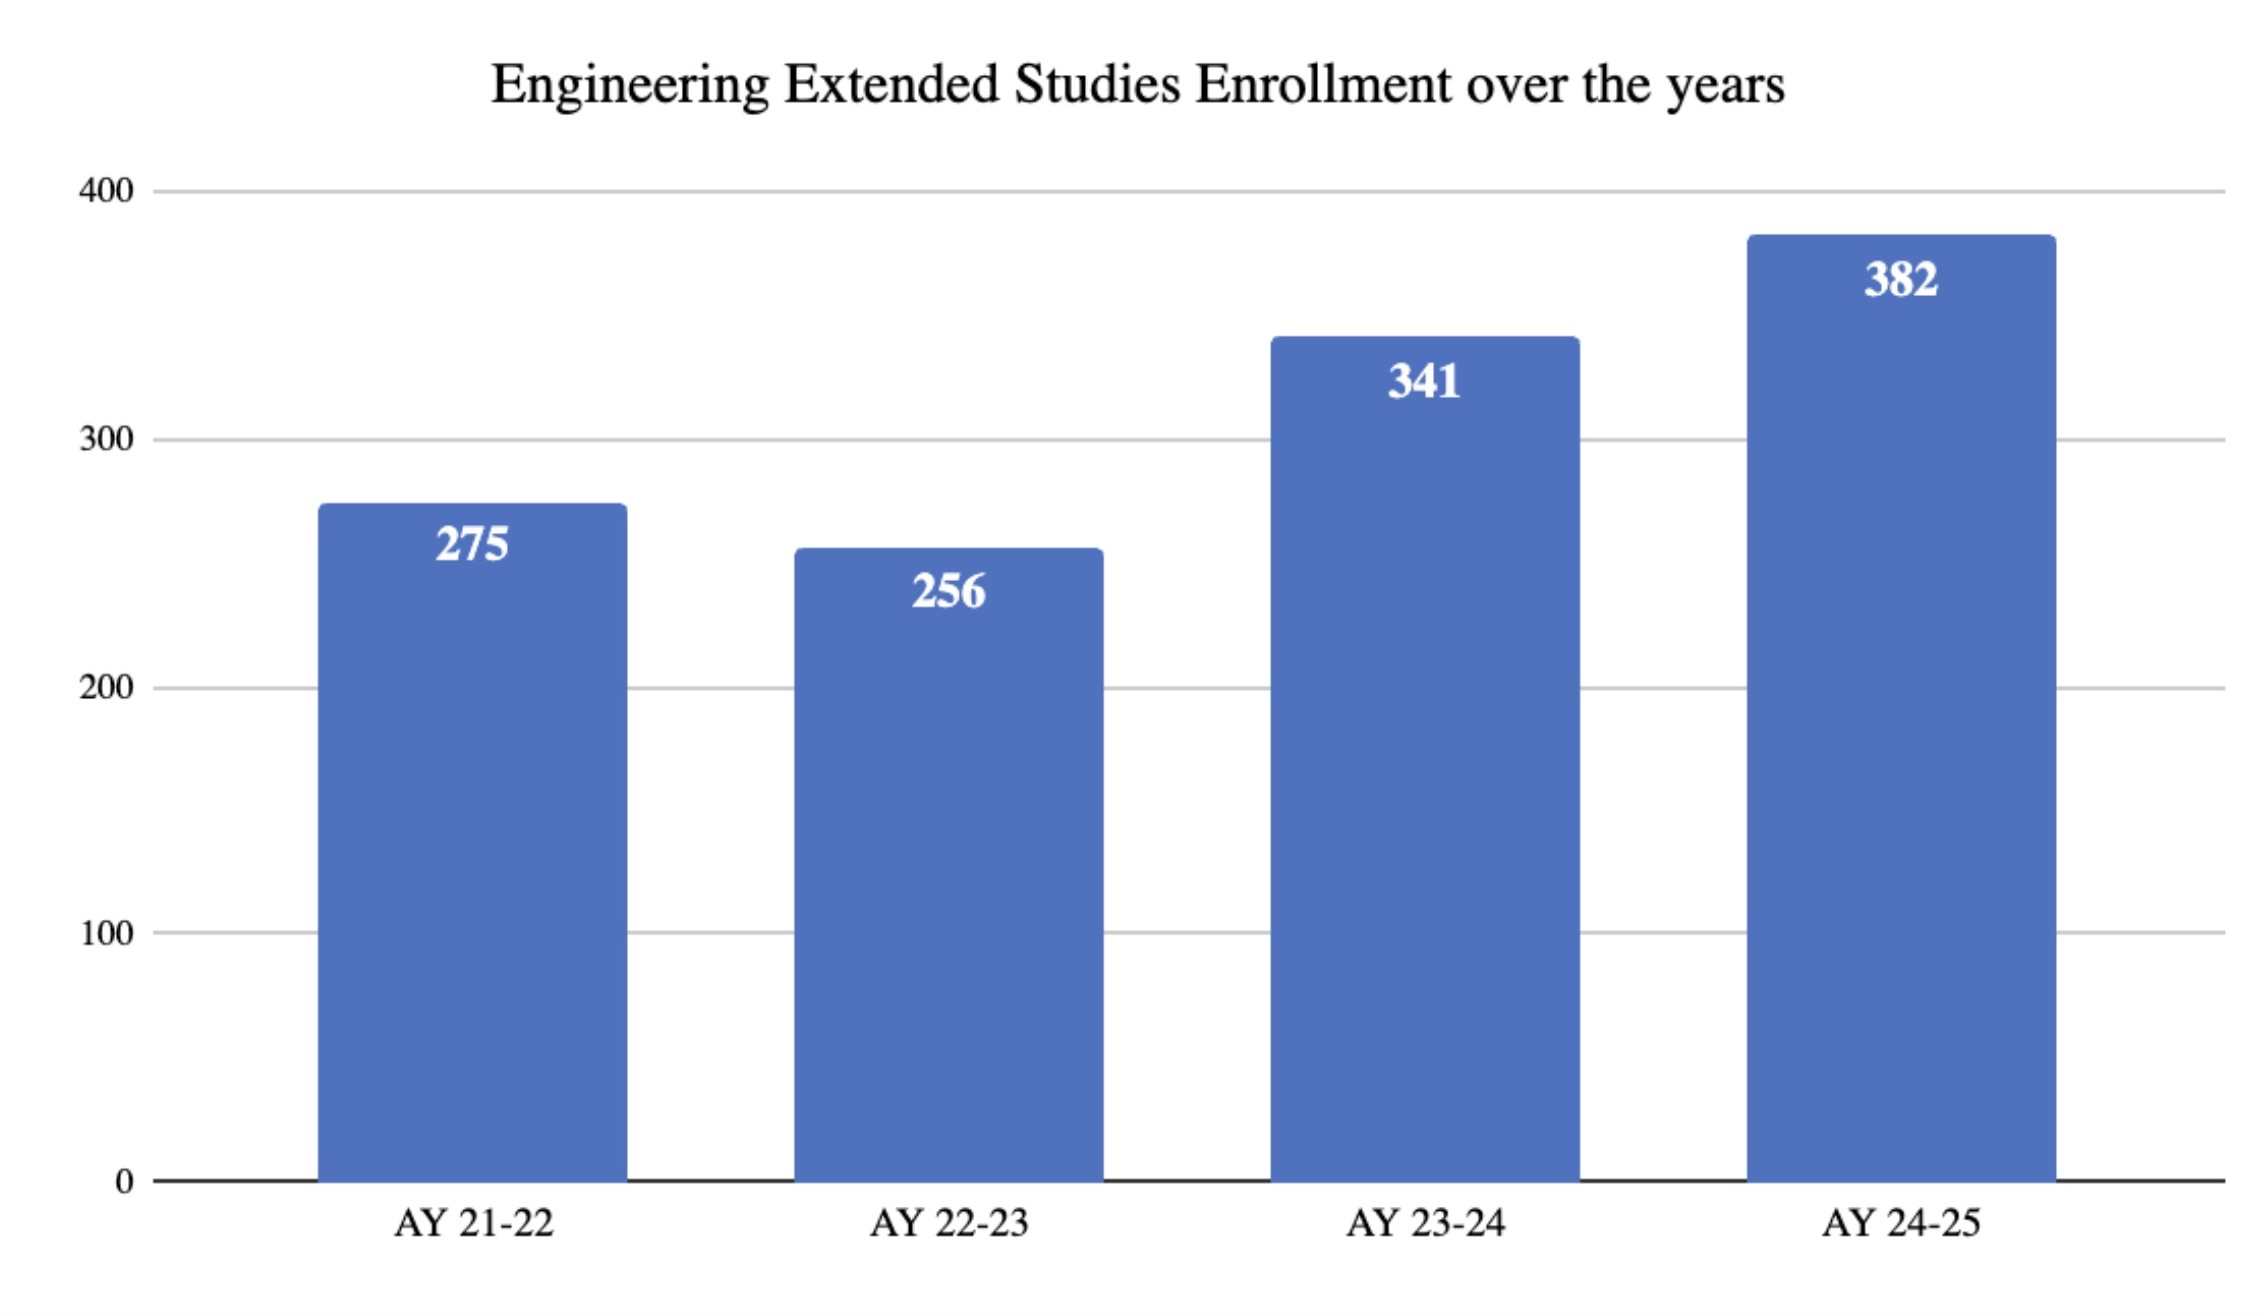
This bar chart entails the steady growth in EES student enrollment since AY 21-22.
EES Enrollment by Program

This bar chart demonstrates student enrollment by major in accordance to each semester from Summer of 2019 to Summer of 2024.
EES Graduation Numbers
